Master Spribe Aviator and Crash Games with AviatorTrends
Whether you’re a casual flier or chasing that big multiplier, AviatorTrends gives you the data-driven edge. In this guide you’ll learn how to:
- Download or analyze Aviator round history results data
- Use Round History for happy hour hunting
- Spot patterns with Time Series graphs
- Predict smarter with the Histogram and Forecast
- Combine all three tools into a winning strategy
Download or Analyze Round History Results Data
Get the last 300+ rounds for statistically reliable trends. Download from AviatorTrends as Excel CSV or analyze directly in-browser with filters.
Pro Tip: Always use 300+ datapoints to ensure your Probability Distribution and Forecast are meaningful.
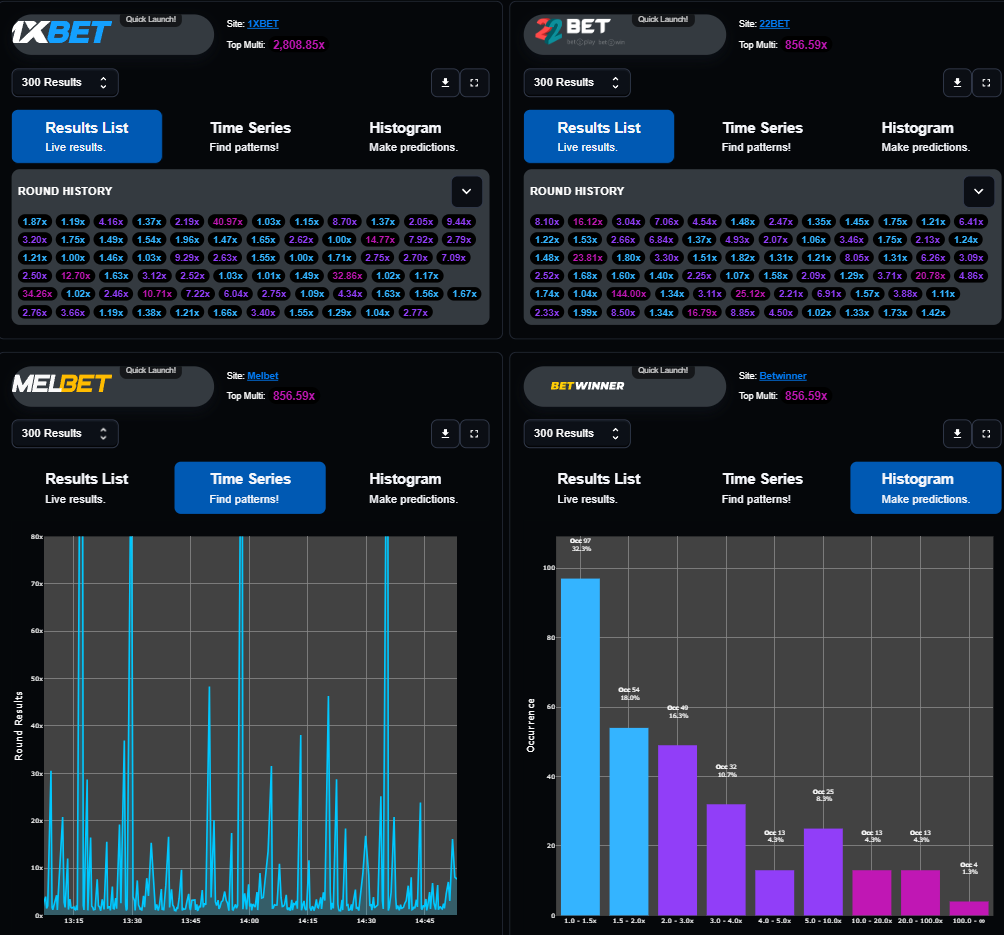
1. Round History: Your Happy Hour Detector
The Round History panel streams live multipliers as they occur. Look for clusters of 10×+ multipliers across multiple casinos in a short span.
- Filter by casino and set threshold (e.g., ≥10×) to catch simultaneous bursts.
- Shift strategy to moderate/aggressive when happy hour forms.
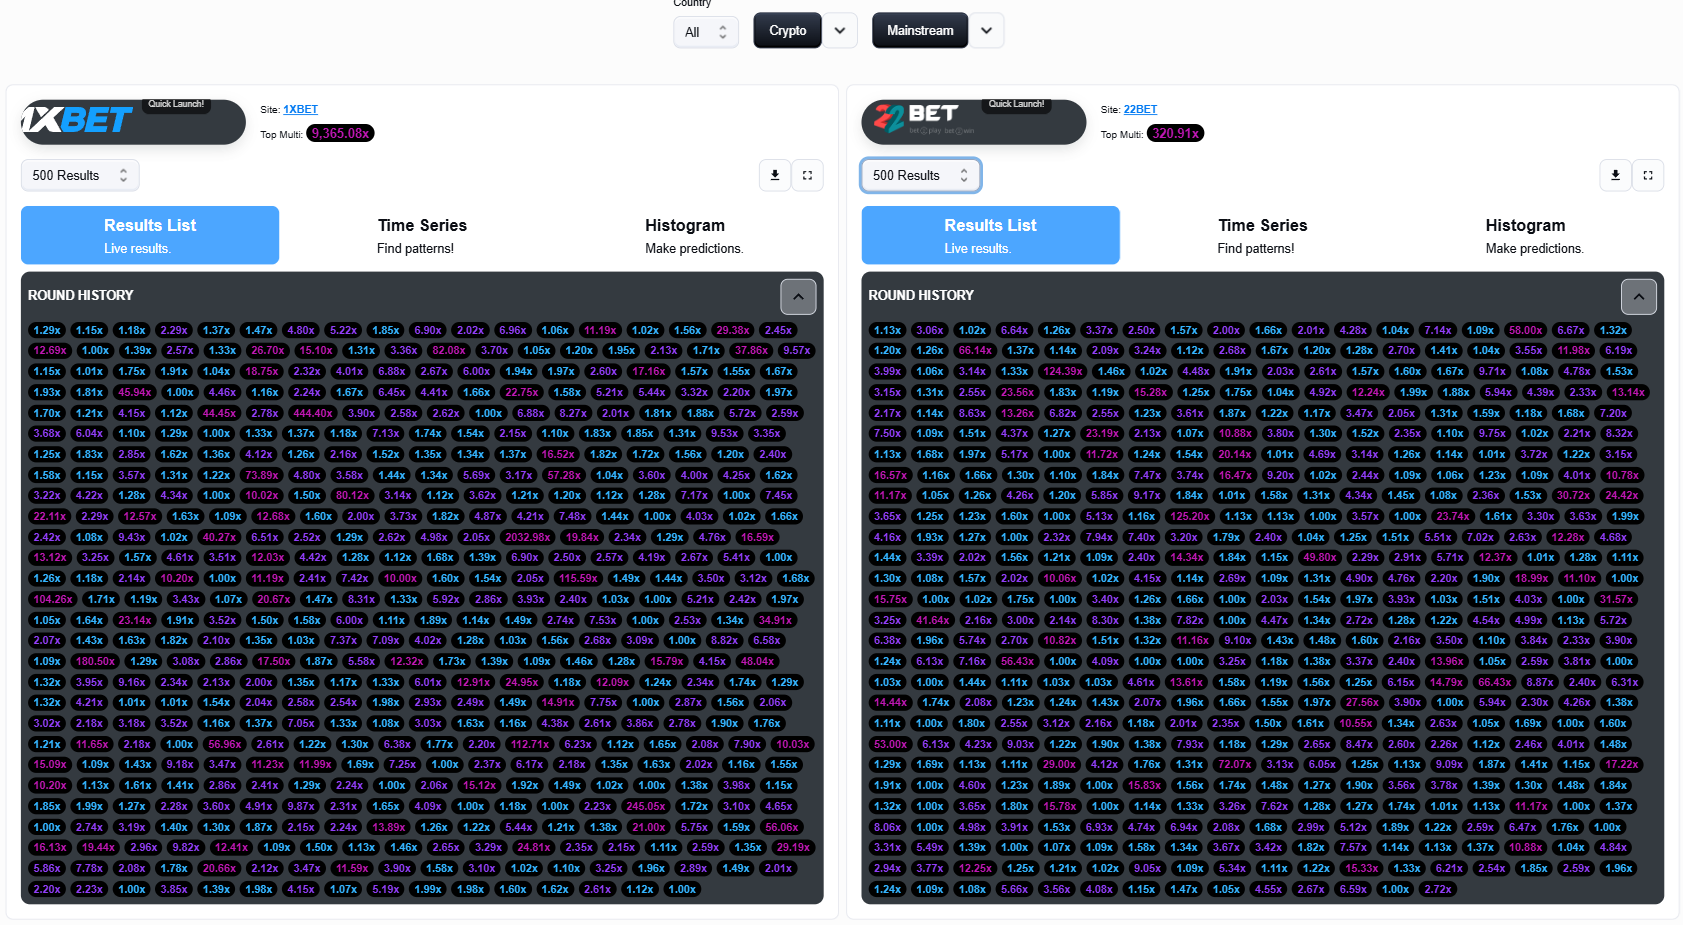
2. Time Series: Spot the Trend
Plot crash multipliers over recent rounds. Identify volatility zones, cycles, and build-up patterns.
- Zoom in on 300 rounds for short-term analysis.
- Use 500+ to detect longer cycles.
- Look for recurring highs every 30–60 rounds.
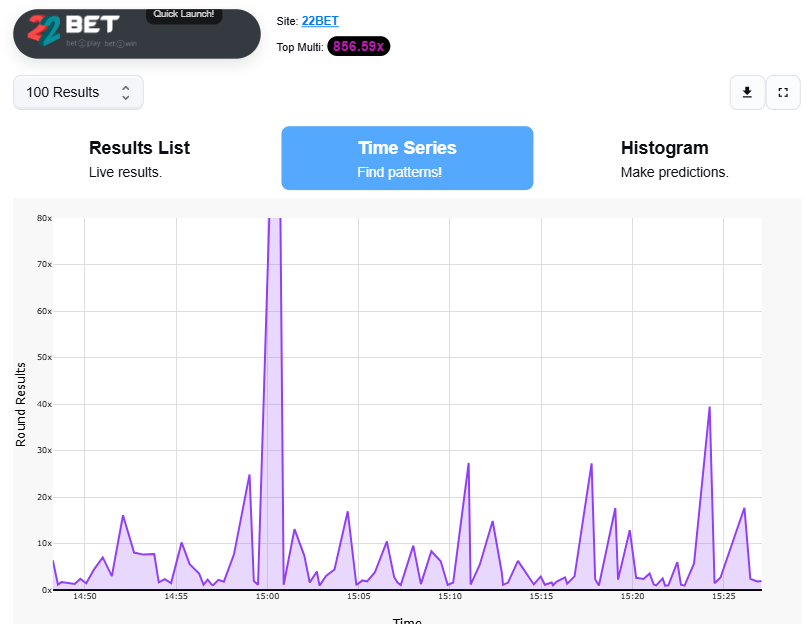
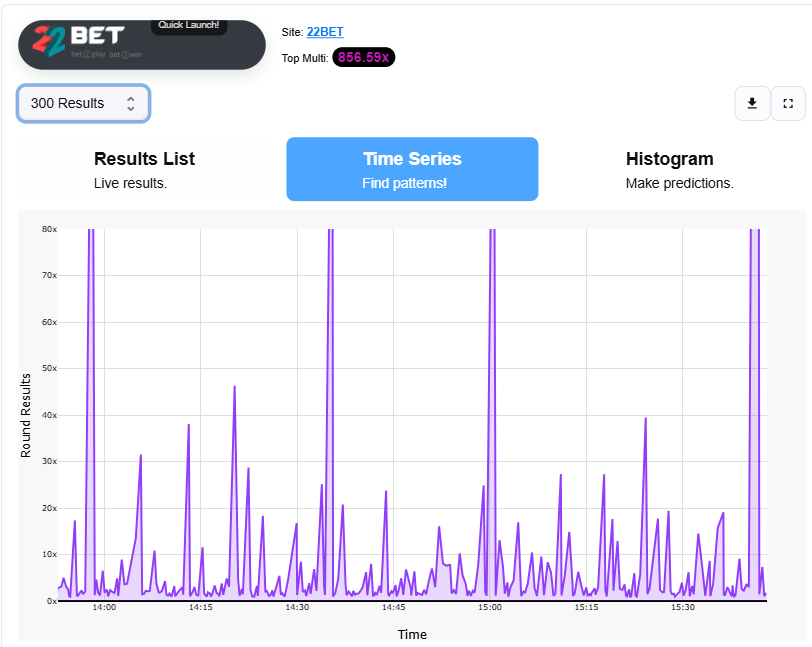
In this example, 100 datapoints show no clear pattern:
But with 300 datapoints, a pattern of spikes appears around 13:55, 14:35, and 15:00. Averagely every 30–40 mins, so expect one around 15:30–15:40.
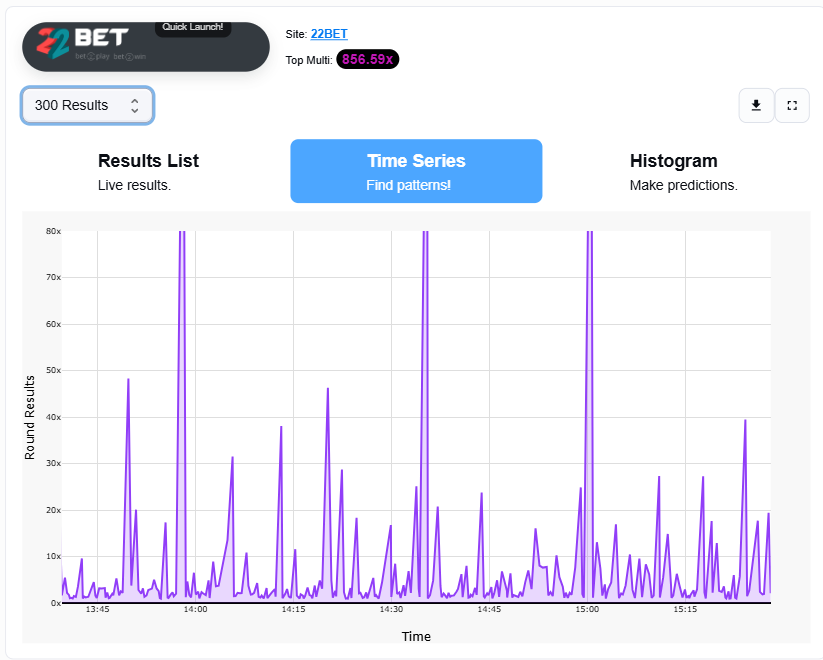
At 15:41, the multiplier hit 337.28× — spot on!
3. Histogram (Probability Distribution): Your Prediction Engine
This shows how often multipliers fall in each bin. Forecast column tells you which ranges are overdue.
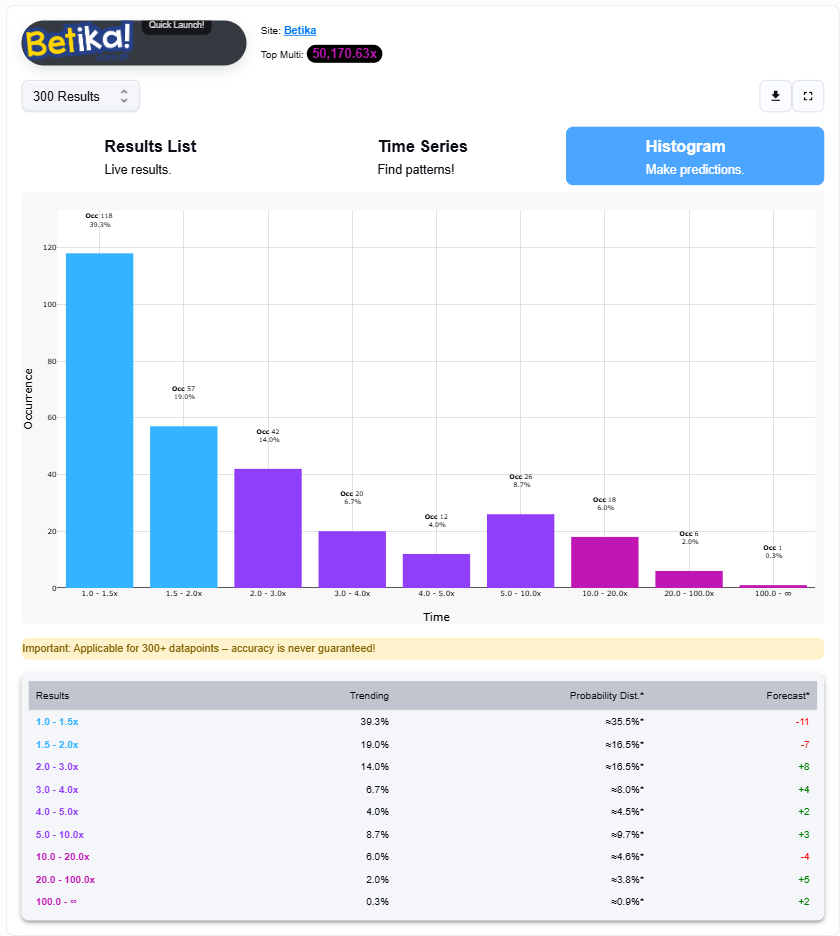
Green (positive forecast) → “due” bins. Red (negative) → likely cooldowns. Looks like there's a happy hour coming up! Track 300+ datapoints for accuracy.
4. Bringing It All Together: A Winning Playbook
- Analyze or download Aviator round history
- Check Round History for happy hours
- Use Time Series for trend cycles
- Forecast best multiplier targets via Histogram
- Log outcomes and refine strategy
Example Strategies
- Conservative: 1.3×–1.5× cashout when green
- Moderate: 5×–6× when 5.0–10.0 shows +3%
- Aggressive: 20×–25× when 10–100 bins are hot
Bankroll Management
- Set a strict budget per session (e.g., $50)
- Avoid chasing losses
- Only use Martingale-style systems for happy hours
Ready to Level Up?
Head over to AviatorTrends now and start predicting crash multipliers like a pro.
More guides
Read also How to Predict Aviator Multipliers Using DataScienceForEveryone